WaterdoctorCity water
Back to the map
Water map · Explainer

Where city water comes from, and what it picks up on the way.

Most people in the United States drink water that a utility treated well before it reached them. The journey from the source to your tap is long, and the last miles are the oldest. This page follows it, one beat at a time.

  1. 01 Source
  2. 02 Treatment plant
  3. 03 The mains
  4. 04 Service line
  5. 05 Home plumbing
  6. 06 Tap & shower
01

Source: rivers, lakes, reservoirs and wells

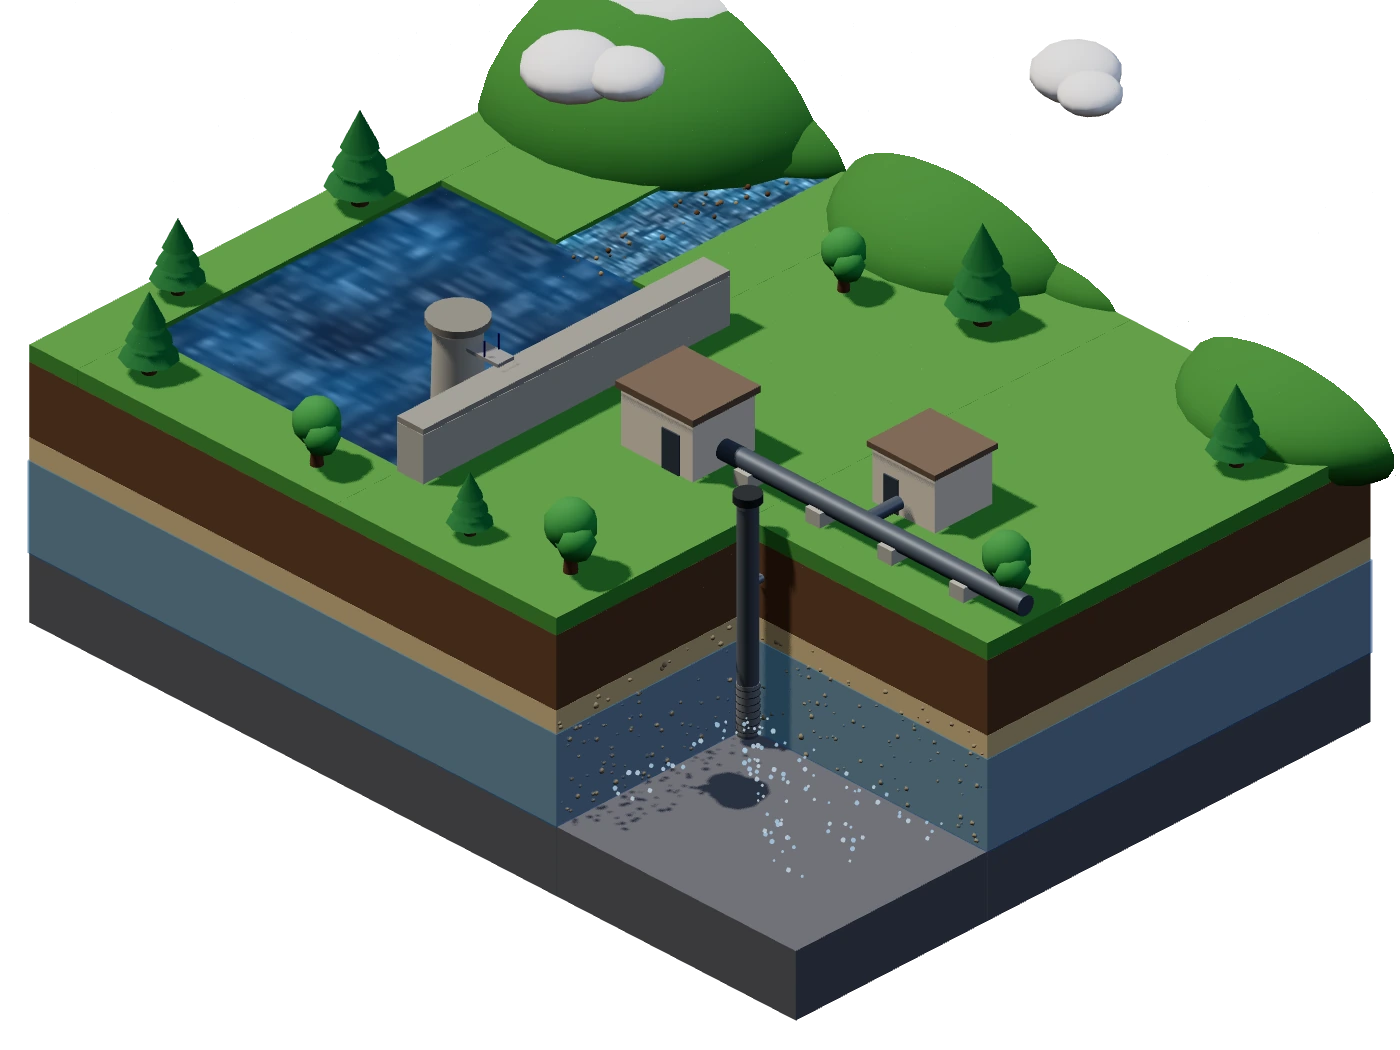
Isometric diagram: rain falls on hills, a river carries sediment into a reservoir behind a dam with an intake tower, and a cut-away pit shows a groundwater well with its screen in the aquifer below the water table. A transmission main leaves for the plant.
Rain and snowmelt feed rivers, reservoirs and aquifers. A utility draws from surface water, from wells, or from both. In the scene, rain and snowmelt on the hills feed the river at the back and the reservoir behind the dam on the left, where an intake tower draws water. The cut-away pit at the front shows a groundwater well reaching below the water table into the aquifer, and the transmission main on the right carries water to the plant. Illustration, not to scale.

About 83% of people in the United States got their water through a public water-supply system in 2020.1 Those systems draw roughly half their water from rivers, lakes and reservoirs and half from wells: in USGS's 2020 estimates, withdrawals from surface water were about 52% and from groundwater about 48%.1

There are over 148,000 public water systems in the country.2 Surface water arrives carrying silt, leaves and whatever washed off the land. Groundwater arrives clearer but with minerals it dissolved on the way: as water moves through soil and rock it dissolves small amounts of naturally occurring minerals and carries them into the groundwater supply.3 Either way, the utility's job starts here.

02

The treatment plant

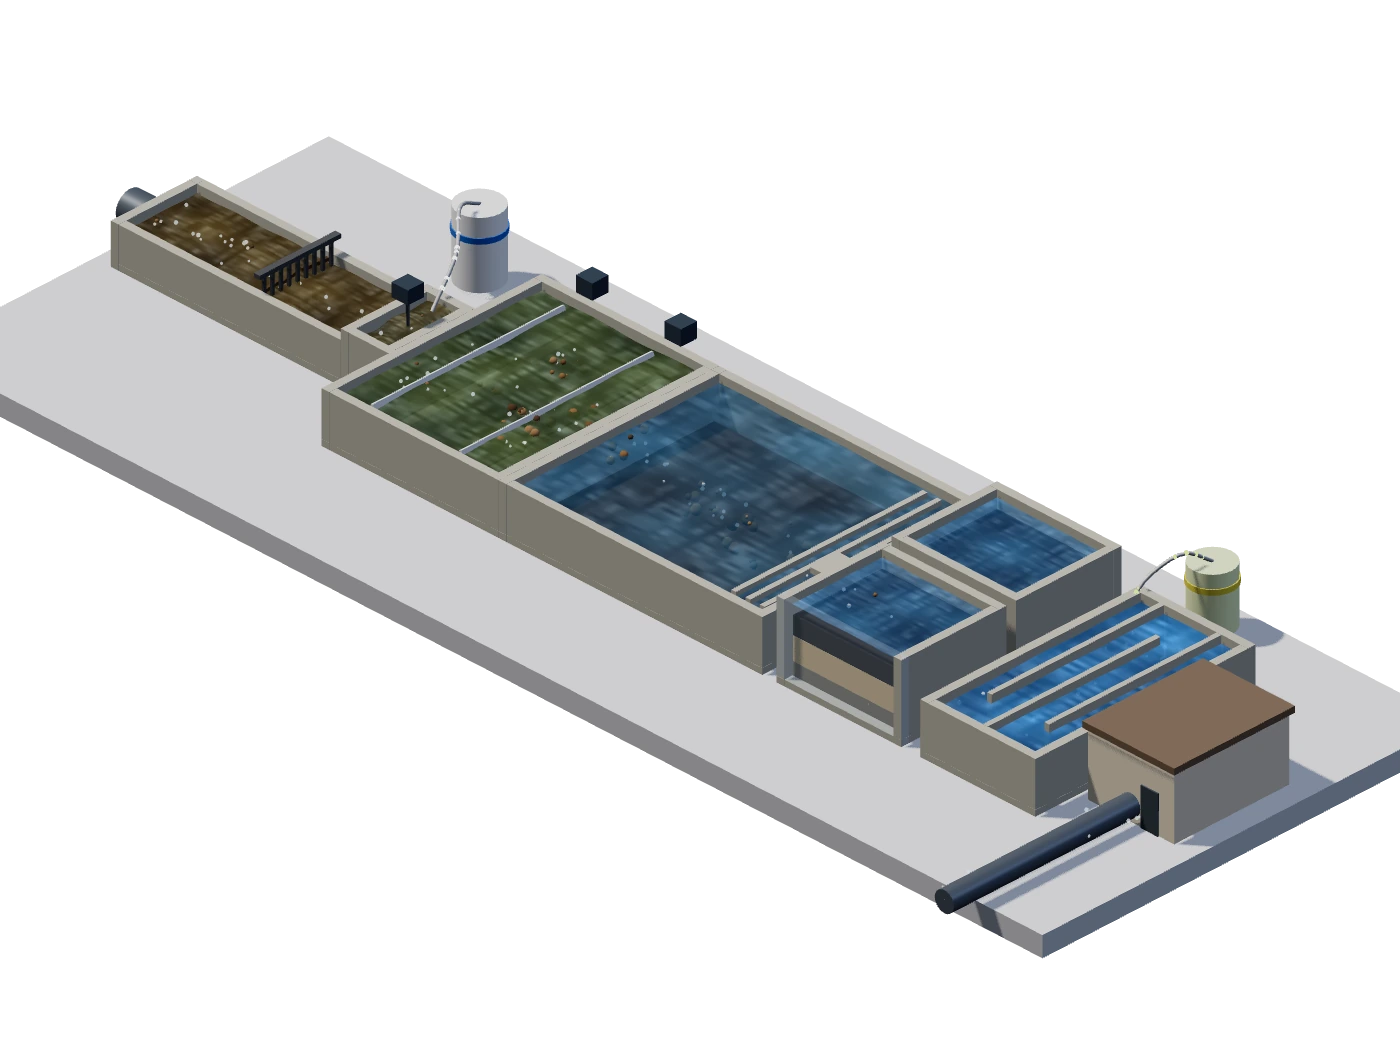
Isometric diagram of a treatment plant train: raw water passes a bar screen, a coagulant is dosed, paddle mixers grow flocs, the flocs settle in a sedimentation basin, the water passes through anthracite, sand and gravel filters, a chlorine feed disinfects it, and pumps send it to the mains.
Screen, coagulate, settle, filter, disinfect. The plant does its job: water leaves it clean, with a little disinfectant on board for the trip. Left to right: raw water passes a bar screen, a coagulant is dosed and rapid-mixed, paddle mixers grow flocs, the flocs settle in the sedimentation basin, the water passes down through anthracite, sand and gravel filters, a chlorine or chloramine feed disinfects it, and the clearwell pumps send it to the mains. Illustration, not to scale.

A conventional plant works in steps. Coagulation adds chemicals, commonly aluminum or iron salts, that help dirt and other small particles bind together. Flocculation is the gentle mixing that grows them into larger, heavier flocs. Sedimentation lets the flocs settle to the bottom. Filtration passes the clear water through sand, gravel or charcoal. Disinfection adds chlorine, chloramine or chlorine dioxide to kill any remaining germs.4

The disinfectant stays in the water on purpose: it keeps killing germs living in the pipes between the treatment plant and your tap.4 More than one in five Americans uses drinking water treated with chloramines, which utilities have used since the 1930s because they provide longer-lasting disinfection as the water moves through pipes to consumers.5 Federal rules cap the residual at 4.0 mg/L for chlorine and for chloramines alike.6

The honest core of this page: water usually leaves the plant clean. What it picks up afterwards is the infrastructure story.

03

The mains: miles of old pipe under the street

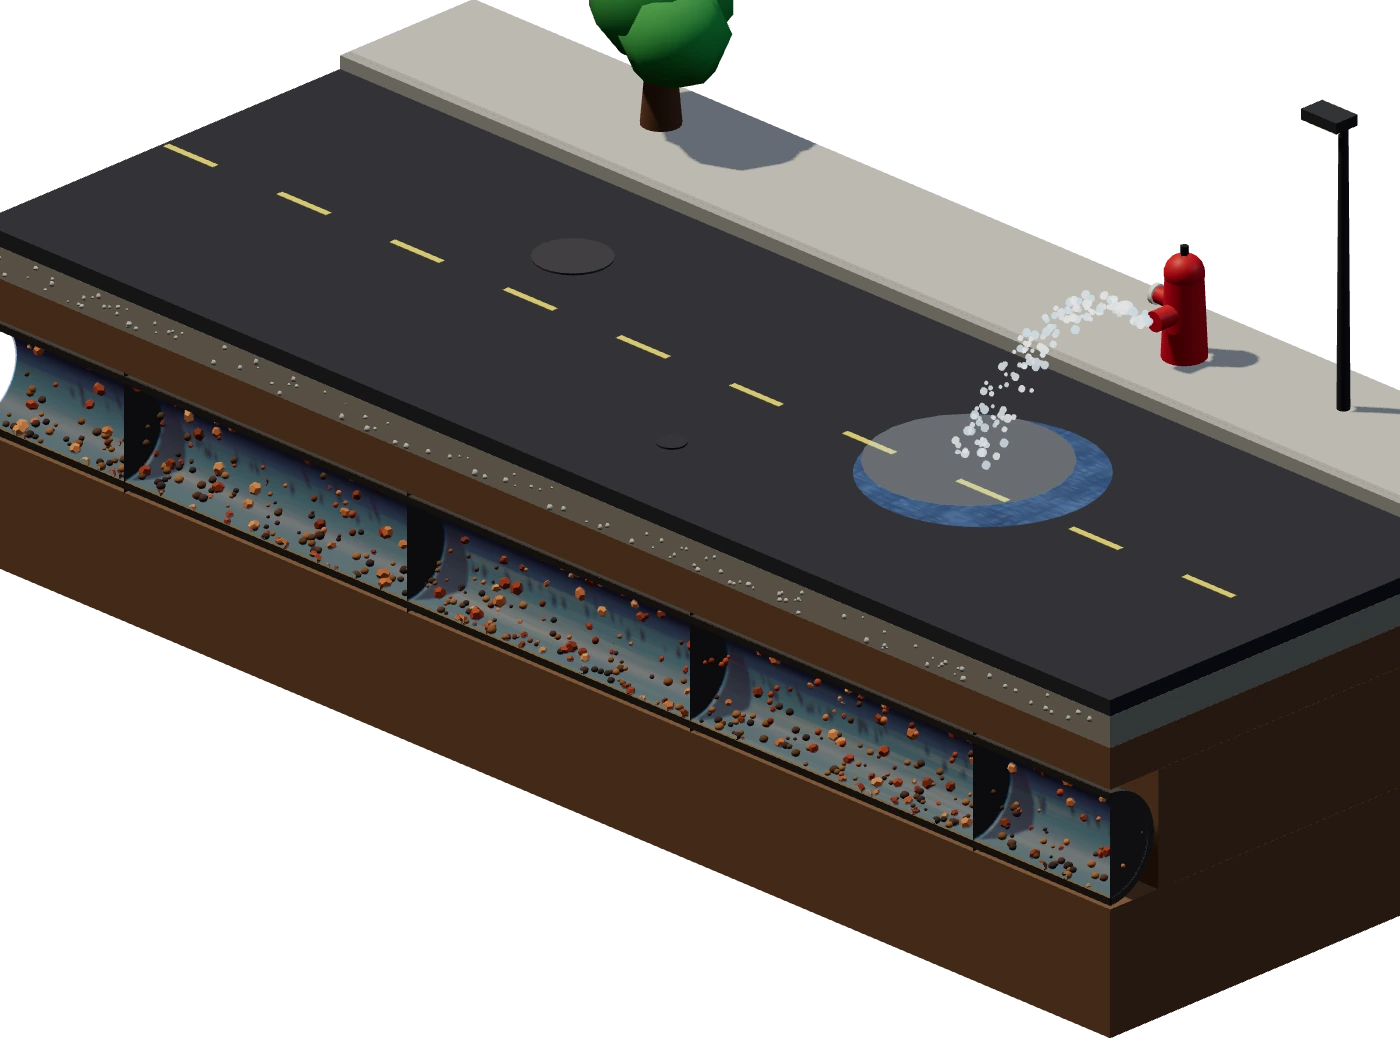
Isometric section under a street: a cast-iron water main is cut open lengthwise, showing rust tubercles on its wall, a bed of settled sediment and biofilm, and water flowing through. On the sidewalk a hydrant opens, the flow surges and the sediment lifts off.
Under the street, the oldest part of the system. Rust tubercles, scale, biofilm and settled sediment line the pipe and wait for a change in flow: a hydrant opening, a main break, a pressure swing. The cast-iron main is cut open along the front: the orange-brown lumps on its wall are rust tubercles, the dark bed along the bottom is settled sediment and biofilm, and the water flows left to right. The red hydrant on the sidewalk opens partway through the loop. Illustration, not to scale.

The water now enters more than 2 million miles of underground transmission and distribution lines. Some of the nation's oldest pipes were laid in the 19th century, and pipes laid after World War II have an average lifespan of 75 to 100 years, so many of even the newer segments are reaching, or have reached, the end of their design life.7

A 2023 Utah State University survey of 802 utilities, covering about 400,000 miles of mains, found cast iron still makes up 23% of pipe, with 86% of it over 50 years old. Cast iron had the highest failure rate of the common materials, 28.6 breaks per 100 miles per year, against an overall average of 11.1; across the United States and Canada that works out to roughly 260,000 water main breaks a year.8

What happens inside the pipe is the point of this page. EPA describes how poor corrosion control leaves thick corrosion layers or tubercles and scale, and corrosion-related sediment; these deposits accumulate organic sediments that act as a habitat and nutrients for bacteria, and corrosion tubercles can contain more coliform bacteria than finished water.9

Loose sediment accumulates in the low-velocity zones, dead ends and reservoirs of a distribution system. It is made of silt, dirt and organics from the source, minerals such as iron and manganese, corrosion by-products, and cell debris that grows and detaches inside the pipes; if it remains loose, it may travel within the distribution system due to changes in flow velocity and/or direction.10 That is why a main break, a hydrant opened for firefighting or flushing, or a pressure swing can send brown water down the street. Flushing is also how utilities deliberately scour pipe surfaces and remove loose sediment, biofilm and scale; depending on the velocity, it can loosen and mobilize sediment in the pipe without fully removing it.11

04

The service line: from the main to your house

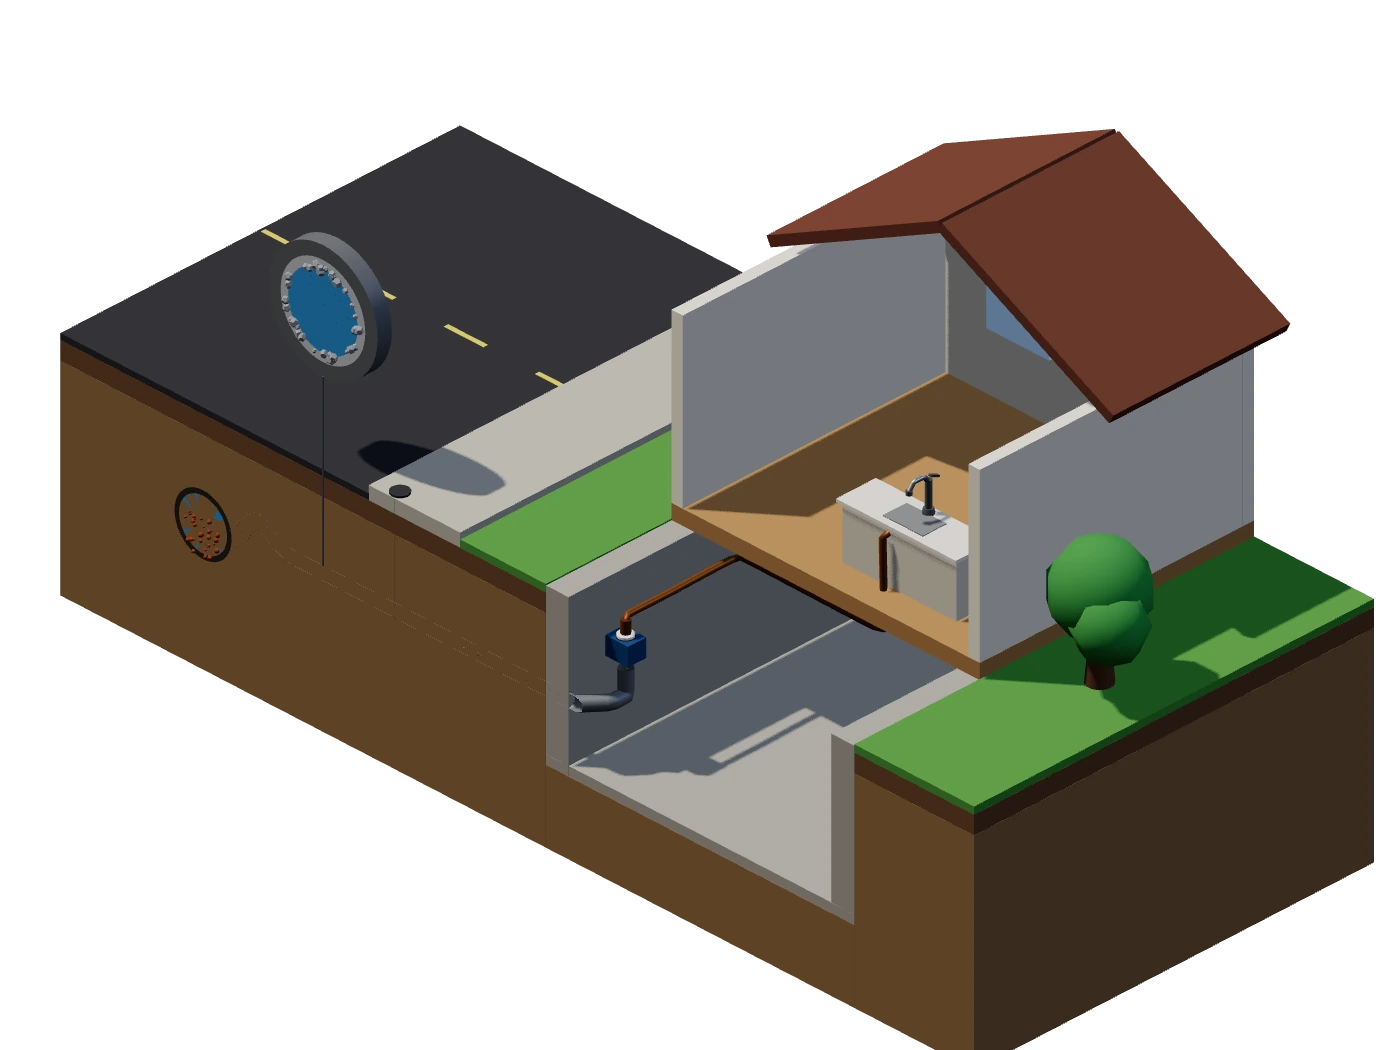
Isometric section: a water main under the street feeds a lead service line through a gooseneck and curb stop into a house's basement and meter. An enlarged cross-section shows the lead pipe wall, its scale layer and the water inside. Over a simulated night the water sits still in the pipe, then the morning's first draw carries it to the kitchen tap.
The pipe from the main to your house. If it is lead, it is usually the biggest source of lead in your water. Water that sits in it overnight has hours in contact with the metal. From the water main under the street, a gooseneck and curb stop lead into the lead service line, which enters the basement at the meter and shutoff and rises to the kitchen tap. The enlarged ring above the street shows the lead pipe wall, its scale layer and the water inside. Illustration, not to scale.

Lead is not in the water when it leaves the plant. Lead can enter drinking water when plumbing materials that contain lead corrode, and in homes with lead pipes that connect the home to the water main, those lead service lines are typically the most significant source of lead in the water.12 Lead pipes are more likely to be found in older cities and homes built before 1986.12 EPA's health goal for lead in drinking water is zero.12

EPA currently estimates that about 4 million lead service lines still serve properties across the United States, revised down from a 9.2 million projection in 2023 as utilities completed their inventories; the 2023 survey also counted an estimated 2.8 million standalone galvanized service lines.1314 The Lead and Copper Rule Improvements, finalized in October 2024, require water systems to replace the lead and galvanized-requiring-replacement service lines under their control within 10 years, with limited exceptions, and lower the lead action level to 0.010 mg/L.15

05

Home plumbing

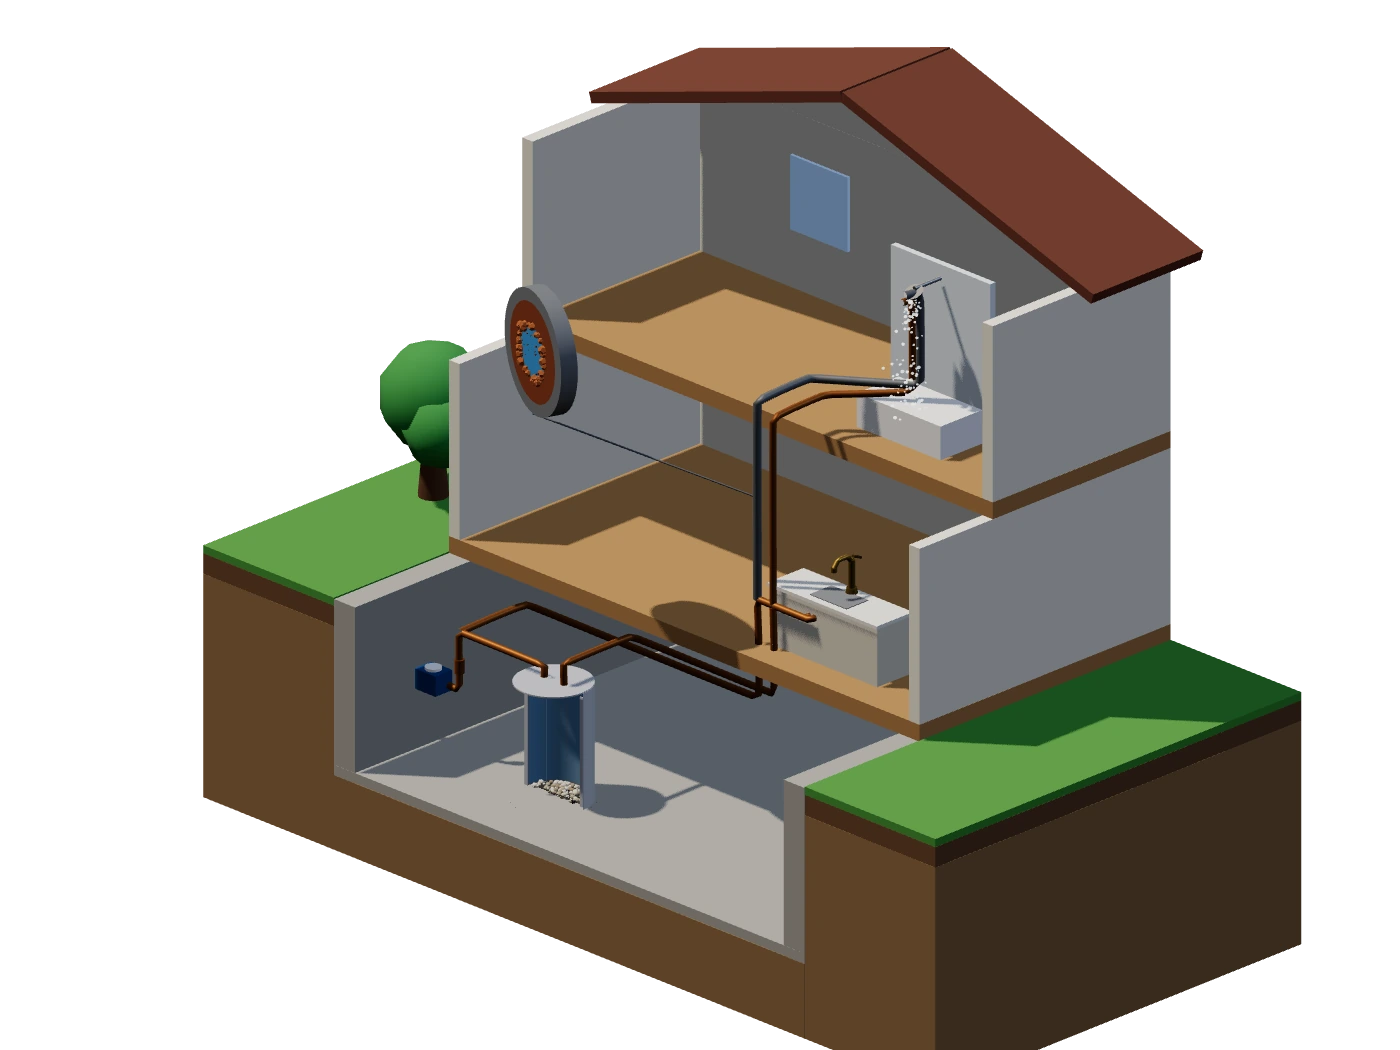
Isometric cut-away house: the service line enters at the meter in the basement, cold copper lines feed a water heater cut open to show sediment settled at the bottom, hot and cold lines rise to a kitchen tap and a shower, and an enlarged cross-section of an old galvanized riser shows rust and scale narrowing the bore.
Your own pipes finish the job. Galvanized steel rusts and scales, older brass and solder can shed lead, and the water heater collects whatever settles. Inside the cut-away house, the service line arrives at the meter and shutoff in the basement, cold lines feed a water heater cut open to show sediment settled at its bottom, hot and cold lines rise to the kitchen tap and the shower, and the enlarged ring shows an old galvanized riser with rust and scale narrowing its bore. Illustration, not to scale.

Inside the house the water meets whatever the builder and every plumber since installed. Older homes may still have galvanized steel pipe; the new federal rule treats a galvanized service line that currently is or ever was downstream of a lead service line as requiring replacement.15 Brass fixtures and solder have contained lead too: in 2011 Congress lowered the maximum lead content of the wetted surfaces of plumbing products from 8% to a weighted average of 0.25%, and 0.2% for solder and flux.16

Hard water adds its own layer. When hard water is heated, such as in a home water heater, solid deposits of calcium carbonate can form; this scale can reduce the life of equipment, raise the costs of heating the water, lower the efficiency of electric water heaters, and clog pipes.3 Long-term movement of hard water through a pipe results in scale buildup, and water pipes can gradually close up, with less water movement and lower pressure.3

06

Tap and shower

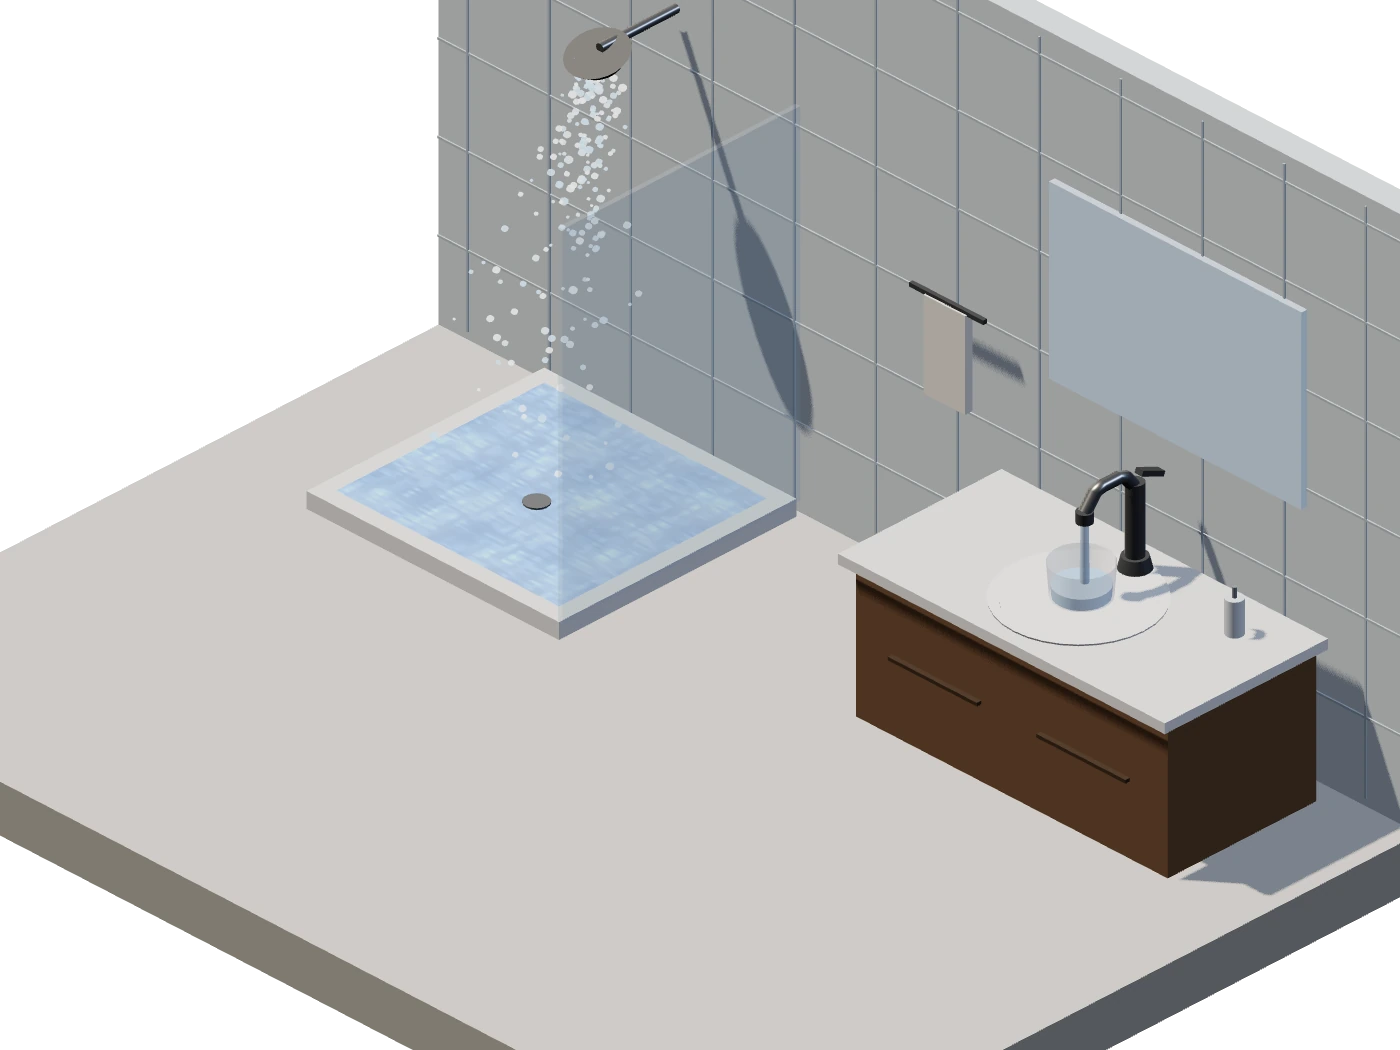
Isometric bathroom: a shower sprays into a tray while a tap fills a glass on the vanity. A few specks drift in the glass.
What comes out is the water the plant made, plus everything the trip added. The specks in the glass are illustrative; most days there are none you can see. A shower on the left, and on the right a tap filling a glass on the vanity. Illustration, not to scale.

By the time it reaches the glass, the water has crossed a plant, miles of main, a service line and your own plumbing. Most of the time it arrives clear, with a trace of disinfectant. When it does not, the usual reason is not the source but the last miles: a flushing crew, a break, a pressure swing, or an old pipe shedding what it has been collecting for decades.91011

EPA's secondary standards describe what that looks like at the tap: iron above 0.3 mg/L gives rusty color, sediment, metallic taste and reddish or orange staining; manganese above 0.05 mg/L gives black to brown color, black staining and a bitter metallic taste.17 These are non-mandatory guidelines for the aesthetics of water, not health limits, which is exactly why a city with clean source water can still deliver a brown glass on flushing day.17

On a well instead? Read the well water page

Sources

Every number and process on this page comes from one of these documents; the quoted passages are verbatim. Accessed 27 October 2026. The scenes are illustrations: proportions, counts, speeds and particle sizes are not to scale.

  1. U.S. Geological Survey, Public Supply Water Use (2020 estimates). About 83% of people living in the United States got their water through public water-supply systems in 2020. Withdrawals from surface water totaled 18,586 mgd (about 52%) and from groundwater 17,236 mgd (about 48%).
  2. U.S. Environmental Protection Agency, Information about Public Water Systems. There are over 148,000 public water systems in the United States.
  3. U.S. Geological Survey Water Science School, Hardness of Water. As water moves through soil and rock it dissolves small amounts of naturally-occurring minerals and carries them into the groundwater supply. When hard water is heated, such as in a home water heater, solid deposits of calcium carbonate can form. This scale can reduce the life of equipment, raise the costs of heating the water, lower the efficiency of electric water heaters, and clog pipes. …long-term movement of hard water through a pipe can result in what is called scale buildup… water pipes can gradually close up resulting in less water movement through the pipe and a lowering of water pressure.
  4. Centers for Disease Control and Prevention, How Water Treatment Works. Coagulation is often the first step in water treatment. Treatment plant staff add chemicals to the water that help bind together dirt and other small particles. Flocculation is the gentle mixing of the water to form larger, heavier particles called flocs. Sedimentation separates out solids from the water. Flocs are heavier than water, so they settle to the bottom of the water during this step. Once the flocs have settled to the bottom of the water, the clear water on top goes through several filters. Common types of chemical disinfectants include chlorine, chloramine, or chlorine dioxide. The residual disinfectant kills germs living in the pipes between the water treatment plant and your tap.
  5. U.S. Environmental Protection Agency, Chloramines in Drinking Water. More than one in five Americans uses drinking water treated with chloramines. Chloramines have been used by water utilities since the 1930s. They provide longer-lasting disinfection as the water moves through pipes to consumers.
  6. U.S. Environmental Protection Agency, National Primary Drinking Water Regulations: maximum residual disinfectant level (MRDL) of 4.0 mg/L (as Cl₂) for chloramines and for chlorine.
  7. American Society of Civil Engineers, 2025 Report Card for America's Infrastructure: Drinking Water (PDF; grade C−). Drinking water infrastructure in the U.S. comprises more than 2 million miles of underground transmission and distribution lines. Some of the nation's oldest pipes were laid in the 19th century, and pipes laid post–World War II have an average lifespan of 75 to 100 years, meaning that many of even the newer pipe segments are reaching or have reached the end of their design life. …there are still approximately 240,000 water main breaks per year…
  8. Barfuss, S. L., Water Main Break Rates in the USA and Canada: A Comprehensive Study, Utah State University, Utah Water Research Laboratory, December 2023. Survey of 802 utilities representing 399,812 miles of water mains. …cast iron at 23%… of reported pipe; Of the reported cast iron pipe, 86% is over 50 years old. …overall water main failures between 2018 and 2023 decreased by 20% from 14.0 to 11.1 breaks/(100 mi-yr). …PVC had the lowest overall failure rate and cast iron had the highest, at 2.9 and 28.6 breaks/(100 mi-yr), respectively. The US and Canada experience about 260,000 water main breaks annually…
  9. U.S. Environmental Protection Agency, Distribution System Water Quality: Impact of Corrosion Control on Disinfectant Residual (Distribution System Toolbox fact sheet, 2023). Poor corrosion control can result in areas of the distribution system with low disinfectant residuals; thick corrosion layers or tubercles/scale; and corrosion-related sediment. These corrosion by-products in the bulk water, on the pipe walls and deposited in the distribution system can accumulate organic sediments that create a disinfectant demand and that act as a habitat and nutrients for opportunistic pathogens. Corrosion tubercles can also contain more coliform bacteria than finished water or untreated source water.
  10. U.S. Environmental Protection Agency, Office of Water, Inorganic Contaminant Accumulation in Potable Water Distribution Systems (Total Coliform Rule issue paper, December 2006), section 4.3. Sediments are loose particulate matter that accumulates in the low-velocity zones, dead ends, and reservoirs of distribution systems. Sediments may be comprised of silt, dirt, and organics from raw water sources, minerals such as iron and manganese, corrosion by-products from the distribution system, treatment by-products, or organic matter and cell debris which grow and detach in the distribution system. … If sediments remain loose, they may travel within the distribution system due to changes in flow velocity and/or direction.
  11. U.S. Environmental Protection Agency, Protecting Water Quality Through Distribution System Flushing (Distribution System Toolbox fact sheet, 2022). Flushing may be performed as part of a regular maintenance program to scour pipe surfaces and remove loose sediment, biofilm, and scale. Depending on flushing velocity and method, flushing can loosen and mobilize sediment in the pipe without fully removing it.
  12. U.S. Environmental Protection Agency, Basic Information about Lead in Drinking Water. Lead can enter drinking water when plumbing materials that contain lead corrode, especially where the water has high acidity or low mineral content that corrodes pipes and fixtures. In homes with lead pipes that connect the home to the water main, also known as lead services lines, these pipes are typically the most significant source of lead in the water. Lead pipes are more likely to be found in older cities and homes built before 1986. EPA has set the maximum contaminant level goal for lead in drinking water at zero…
  13. U.S. Environmental Protection Agency, Lead Service Lines (page updated March 2026) and EPA's 7th Drinking Water Infrastructure Needs Survey and Assessment. An estimated 4 million lead service lines (LSLs) serve water to properties in communities across the United States. The 7th DWINSA now estimates a total of four million lead service lines.
  14. U.S. Environmental Protection Agency, 7th Drinking Water Infrastructure Needs Survey and Assessment, Fact Sheet (April 2023). Based on the findings from the 7th DWINSA, the total projected LSL in the United States is 9.2 million… There are also an estimated 2.8 million standalone galvanized service lines.
  15. U.S. Environmental Protection Agency, Lead and Copper Rule Improvements: Fact Sheet for States and Public Water Systems (October 2024). EPA is requiring water systems to conduct full replacement of all lead and galvanized requiring replacement (GRR) service lines that are under the control of the water system in 10 years or less, with limited exceptions… …the lead action level of 0.010 mg/L… A GRR service line is a galvanized service line that currently is or ever was downstream of an LSL or is currently downstream of a service line of unknown material. See also EPA, Lead and Copper Rule Improvements: There is no safe level of lead exposure.
  16. U.S. Environmental Protection Agency, Use of Lead Free Pipes, Fittings, Fixtures, Solder, and Flux for Drinking Water. In 2011 Congress passed the Reduction of Lead in Drinking Water Act (RLDWA) revising the definition of lead free by lowering the maximum lead content of the wetted surfaces of plumbing products… from 8% to a weighted average of 0.25%; lead free now means a weighted average of 0.25% lead calculated across the wetted surfaces of a pipe, pipe fitting, plumbing fitting, and fixture and 0.2% lead for solder and flux.
  17. U.S. Environmental Protection Agency, Secondary Drinking Water Standards: Guidance for Nuisance Chemicals. Iron, 0.3 mg/L: rusty color; sediment; metallic taste; reddish or orange staining. Manganese, 0.05 mg/L: black to brown color; black staining; bitter metallic taste. EPA has established National Secondary Drinking Water Standards that set non-mandatory water quality standards for 15 contaminants.

Waterdoctor · maps.waterdoctor.co · educational page, no products, no tracking