WaterdoctorWell water
Back to the map
Water map · Explainer

Well water: your own source, your own responsibility.

About one in seven Americans drinks from a private well. No utility treats that water and no agency monitors it.13 This page follows it from the sky to your tap, one beat at a time.

  1. 01 Recharge
  2. 02 The well
  3. 03 What rides along
  4. 04 What only a test shows
01

Recharge: from rain and snowmelt to the aquifer

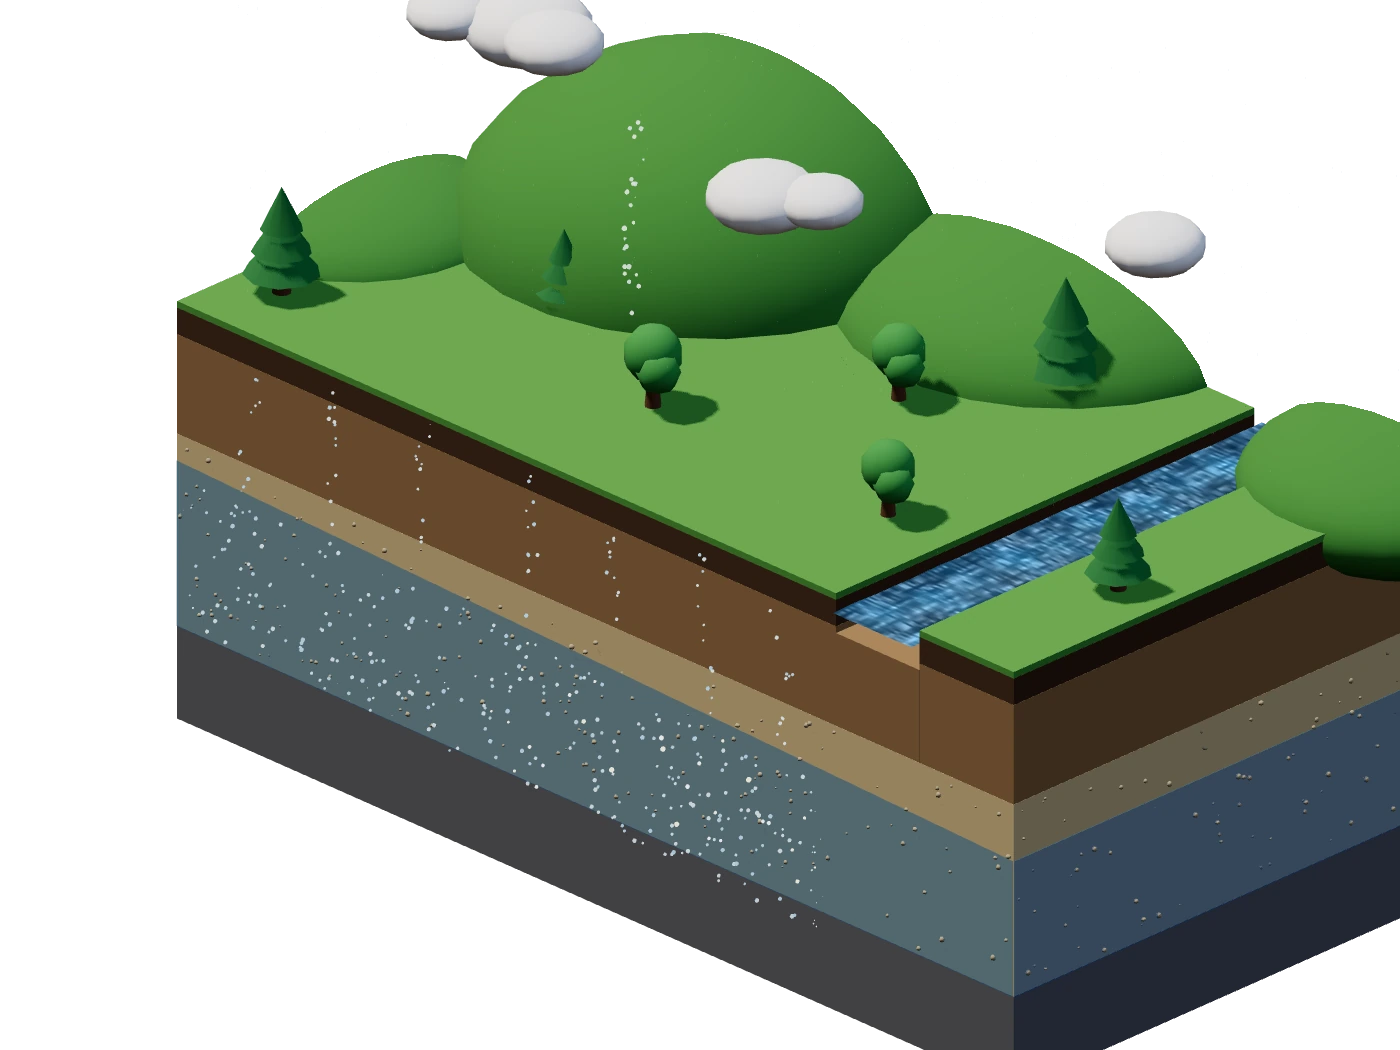
Isometric landscape section: rain falls and snow melts on hills, drops trickle down through soil to a sloping water table, and groundwater creeps sideways through a sand-and-gravel aquifer above bedrock toward a small stream, picking up bright specks of dissolved mineral on the way.
Rain and snowmelt soak in, trickle down to the water table, and creep through the aquifer. On the way the water dissolves minerals out of soil and rock. In the cut-away: rain and snowmelt at the surface, the dry unsaturated zone below it, the water table where the ground turns saturated, the sand-and-gravel aquifer beneath, bedrock at the bottom, and on the right a stream fed by groundwater. Illustration, not to scale.

Some part of the precipitation that lands on the ground infiltrates into the subsurface; the part that continues downward until it reaches saturated rock is groundwater recharge.1 Below the water table, water fills the tiny spaces between rock particles and the cracks in the rock, and there is about a hundred times more fresh water in the ground than in all the world's rivers and freshwater lakes.1

As water moves through soil and rock it dissolves small amounts of naturally occurring minerals and carries them into the groundwater supply.2 That is where hardness, iron and manganese come from, and in some places arsenic and radon. Almost all self-supplied domestic water in the United States comes from groundwater.3

02

The well: casing, screen, pump, pressure tank

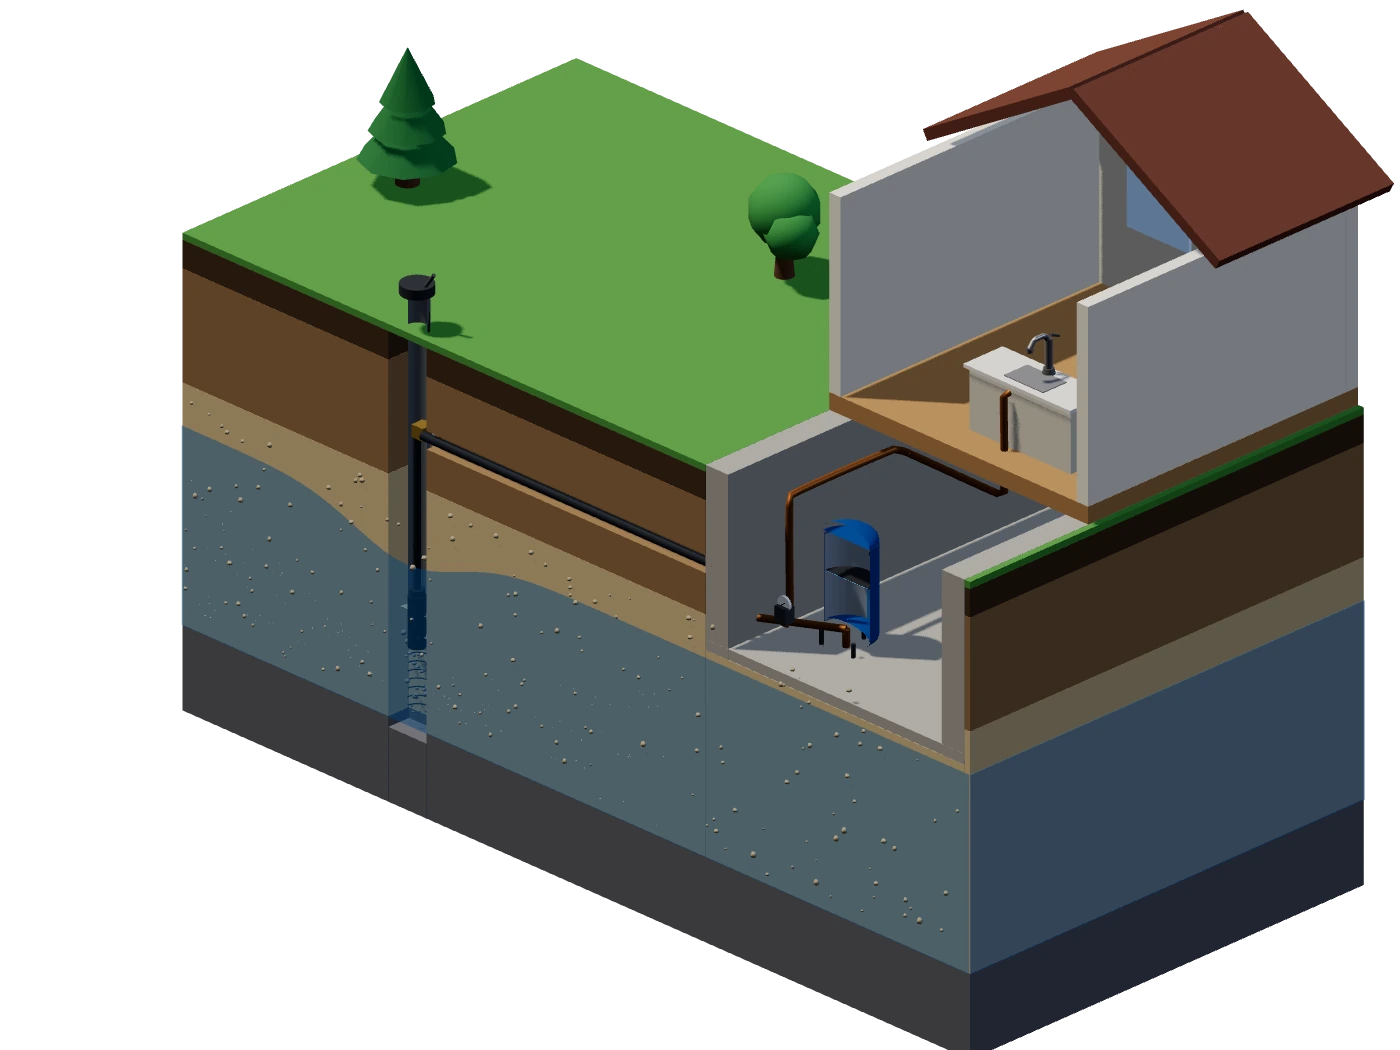
Isometric section of a drilled well: a capped steel casing sealed with grout passes through soil and the water table to a slotted screen packed in gravel in the aquifer; a submersible pump sends water up a drop pipe to a pitless adapter below the frost line and along a buried line into a basement pressure tank with its switch and gauge, then on to a tap. While the pump runs, the water table dips around the screen.
No treatment plant, no chlorine unless the owner adds it, and typically no routine testing: the owner is responsible for the well and its water.713 The pressure switch starts the pump, the tank fills, a tap drains it, and the cycle repeats. Top to bottom in the well: the cap and vent at the surface, the casing with its grout seal, the pitless adapter below the frost line where the buried line leaves for the house, the submersible pump, and the screen and gravel pack in the aquifer. In the house: the pressure tank with its switch and gauge, then the tap. Illustration, not to scale.

More than 43 million people, about 15 percent of the U.S. population, rely on domestic (private) wells as their source of drinking water.4 Drilled wells are constructed by percussion or rotary-drilling machines and can be thousands of feet deep. The casing keeps the well open from the aquifer to the surface; a screen at the bottom of the casing keeps most sand and gravel out; a pitless adapter lets the pipe to the house stay below the frost line; and for deep wells a submersible pump does the lifting.56

The quality and safety of water from domestic wells are not regulated by the Federal Safe Drinking Water Act or, in most cases, by state laws. Typically the water is not routinely tested, and individual homeowners are responsible for maintaining their well systems and for monitoring water quality.7 Government officials do not regulate, treat, or monitor tap water from private wells.13

03

What rides along: hardness, iron, manganese, sediment

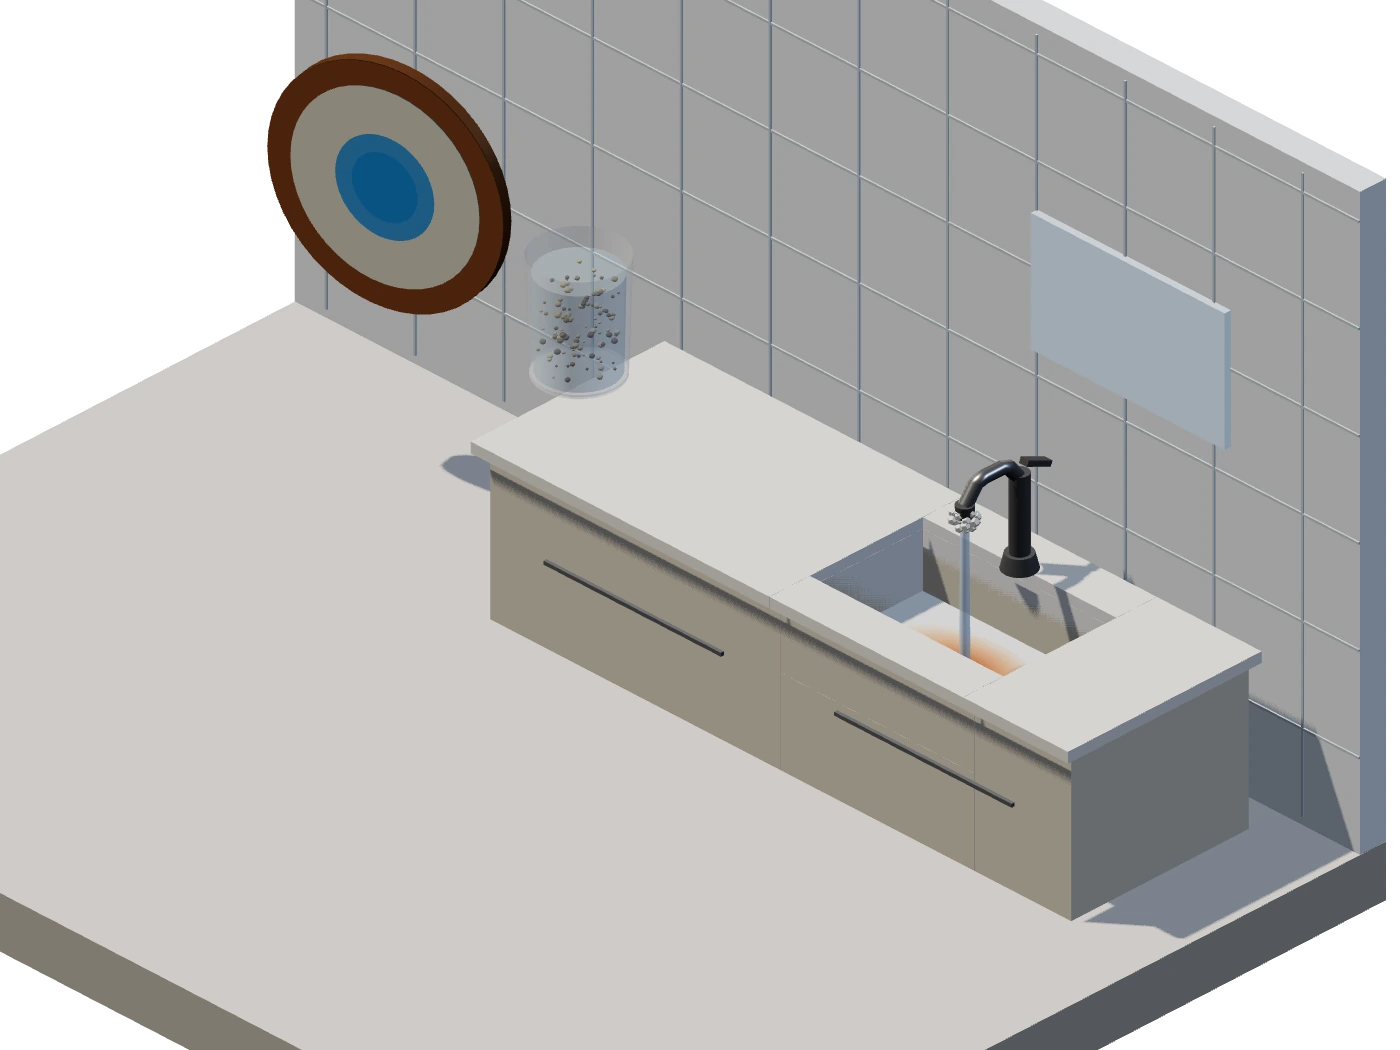
Isometric kitchen vignette: white hardness crust grows on a faucet spout, an orange-brown iron stain and a dark manganese stain spread in the sink, sand and silt settle to the bottom of a jar of well water, and an enlarged pipe cross-section shows scale thickening inside the bore.
The everyday passengers. Minerals dissolved from rock come back out on fixtures and in pipes; sand and silt simply settle. The loop compresses years into seconds. In the scene, hardness scale whitens the spout, iron stains orange-brown and manganese stains black around the basin, sand and silt settle in the jar, and the cut pipe shows scale narrowing the bore over the years. Illustration, not to scale.

Hardness is caused by compounds of calcium and magnesium. USGS classifies 0 to 60 mg/L as calcium carbonate as soft, 61 to 120 as moderately hard, 121 to 180 as hard, and more than 180 as very hard.2 When hard water is heated, such as in a home water heater, solid deposits of calcium carbonate can form, and long-term movement of hard water through a pipe results in scale buildup that gradually closes the pipe.2

EPA's secondary standards describe the nuisance thresholds: iron above 0.3 mg/L brings rusty color, sediment, metallic taste and reddish or orange staining; manganese above 0.05 mg/L brings black to brown color, black staining and a bitter metallic taste.8

These are common. In the USGS national study of about 2,100 domestic wells, dissolved solids, pH, iron and manganese were found outside EPA's secondary levels in 15 to 21 percent of wells each, and about half (48 percent) of the wells had at least one contaminant or property outside those aesthetic guidelines.9 A Penn State survey found excessive iron in 17% of the private water supplies it sampled, and natural iron and manganese are more common in deeper wells where the water has been in contact with rock for longer.10

Sand and silt get in when the screen or gravel pack lets them through. Well screens are filtering devices used to prevent excess sediment from entering the well, and high-speed water velocity, due to excessive pumping or an improperly sized gravel pack, may result in erosion of the aquifer as sediment is pulled into the well.11

04

What only a test shows: bacteria, nitrate, arsenic

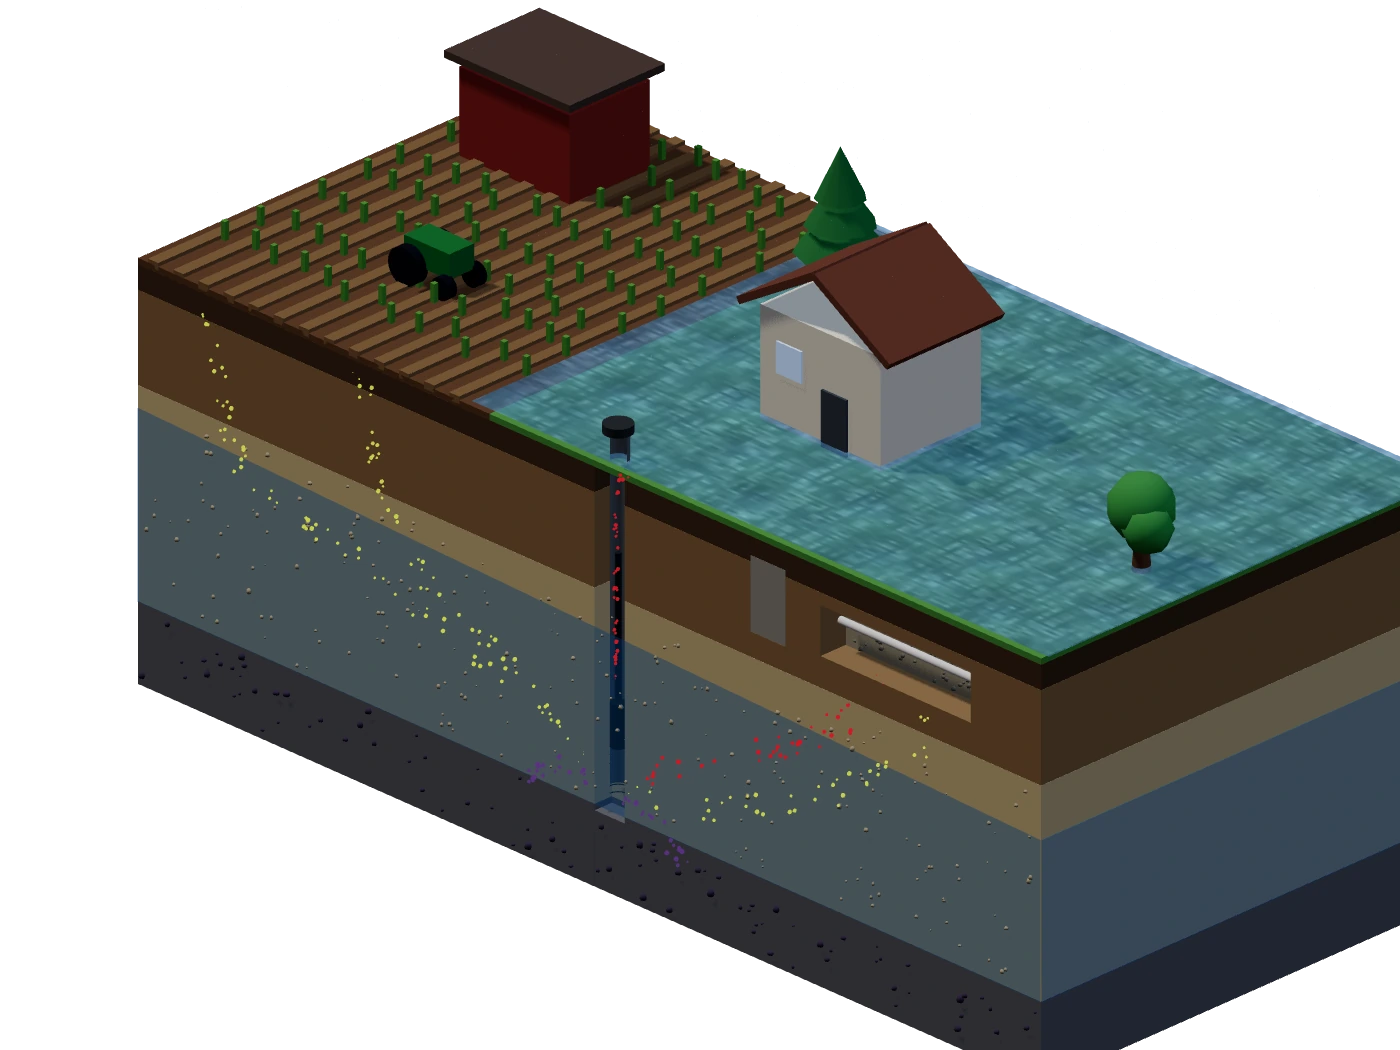
Isometric landscape section with a farm field, a cottage, its well and a septic tank and drainfield. Slow plumes drift with the groundwater toward the well: nitrate from the field and the drainfield, bacteria from the drainfield, and arsenic leaching from bedrock. After heavy rain, flood water finds its way down a poorly sealed well.
Some of what matters is invisible. Nitrate from fields and septic systems, bacteria from the surface, arsenic from certain rocks: none of it shows in the glass. In the cut-away, fertilizer and manure on the field at the left and the septic tank and drainfield at the right send nitrate and bacteria toward the well in the middle; natural arsenic sits in the bedrock at the bottom; after heavy rain, flood water finds its way down an unsealed well. Illustration, not to scale; plumes are schematic.

In the USGS study of about 2,100 domestic wells sampled between 1991 and 2004, more than one in five (23 percent) contained one or more contaminants at a concentration greater than a human-health benchmark.9 Nitrate was above the 10 mg/L standard in 4.4 percent of wells, most often in agricultural areas; elevated nitrate usually originates from fertilizers, livestock and septic systems.914 Arsenic was above its 10 µg/L standard in 6.8 percent of wells, almost always from natural geologic sources; a later USGS–CDC model estimated that about 2.1 million people may be getting their drinking water from private wells with high arsenic.912 E. coli was detected in 7.9 percent of the roughly 400 wells tested for microbes, and total coliform bacteria in 34 percent.9

CDC's advice is simple: test your well water at least once every year for total coliform bacteria, nitrates, total dissolved solids and pH, using a state-certified laboratory.13 Test again if there are problems near the well such as flooding, land disturbances or nearby waste disposal, if you are notified of problems with well water in your area, or when someone in the house becomes pregnant or a child moves in.13 Ask your health or environmental department whether to also test for arsenic, lead, radium, mercury, volatile organic compounds, pesticides or other chemicals that matter where you live.13

The well on the map is not a verdict on your water. It is a reminder that, on a well, the lab report is the only treatment plant you have.

On city water instead? Read the city water page

Sources

Every number and process on this page comes from one of these documents; the quoted passages are verbatim. Accessed 27 October 2026. The scenes are illustrations: proportions, counts, speeds, plumes and particle sizes are not to scale.

  1. U.S. Geological Survey Water Science School, Groundwater: What is Groundwater? Some part of the precipitation that lands on the ground surface infiltrates into the subsurface. The part that continues downward through the soil until it reaches rock material that is saturated is groundwater recharge. The saturated zone below the water table has water that fills the tiny spaces (pores) between rock particles and the cracks (fractures) of the rocks. …there is about a hundred times more fresh water in the ground than is in all the world's rivers and freshwater lakes.
  2. U.S. Geological Survey Water Science School, Hardness of Water. As water moves through soil and rock it dissolves small amounts of naturally-occurring minerals and carries them into the groundwater supply. Hardness is caused by compounds of calcium and magnesium, and by a variety of other metals. 0 to 60 mg/L (milligrams per liter) as calcium carbonate is classified as soft; 61 to 120 mg/L as moderately hard; 121 to 180 mg/L as hard; and more than 180 mg/L as very hard. When hard water is heated, such as in a home water heater, solid deposits of calcium carbonate can form. …long-term movement of hard water through a pipe can result in what is called scale buildup… water pipes can gradually close up…
  3. U.S. Geological Survey Water Science School, Groundwater Use in the United States (2015 data). Almost all self-supplied domestic water came from groundwater.
  4. U.S. Geological Survey, Domestic (Private) Supply Wells. More than 43 million people—about 15 percent of the U.S. population—rely on domestic (private) wells as their source of drinking water. Also U.S. Environmental Protection Agency, Private Drinking Water Wells: Around 15 percent of the U.S. population (over 43 million) rely on private wells as their source of drinking water.
  5. U.S. Environmental Protection Agency, Learn About Private Water Wells. Drilled wells are constructed by percussion or rotary-drilling machines. Drilled wells can be thousands of feet deep and require the installation of casing. Well casing is the tube-shaped structure placed in the well to maintain the well opening from the target ground water to the surface. Well screens are attached to the bottom of the casing to prevent too much sediment from entering the well. A pitless adapter is a connector that allows the pipe carrying water to the surface to remain below the frost line. Submersible pumps are the most commonly used pumps for deep private wells.
  6. University of Maryland Extension, Understanding and Maintaining Private Wells. Well screens allow water to move through the well, while keeping out most gravel and sand. An airtight seal prevents surface water and contaminants from running down the side of the well.
  7. U.S. Geological Survey, Domestic (Private) Supply Wells. The quality and safety of water from domestic wells are not regulated by the Federal Safe Drinking Water Act or, in most cases, by state laws. Typically, the water supplied by domestic wells is not routinely tested. Instead, individual homeowners are responsible for maintaining their domestic well systems and for monitoring water quality.
  8. U.S. Environmental Protection Agency, Secondary Drinking Water Standards: Guidance for Nuisance Chemicals. Iron, 0.3 mg/L: rusty color; sediment; metallic taste; reddish or orange staining. Manganese, 0.05 mg/L: black to brown color; black staining; bitter metallic taste. Total dissolved solids, 500 mg/L: hardness; deposits; colored water; staining; salty taste.
  9. DeSimone, L. A., Hamilton, P. A., and Gilliom, R. J., Quality of Water from Domestic Wells in Principal Aquifers of the United States, 1991–2004: Overview of Major Findings, U.S. Geological Survey Circular 1332 (2009). More than one in five (23 percent) of the sampled wells contained one or more contaminants at a concentration greater than a human-health benchmark. Nitrate was measured at concentrations greater than the USEPA MCL of 10 milligrams per liter as N in 4.4 percent of all wells and was most frequently found at these concentrations in wells in agricultural areas. Nitrate occurs naturally, but elevated concentrations usually originate from man-made sources, including fertilizers, livestock, and septic systems. Arsenic was found at concentrations greater than the MCL of 10 micrograms per liter (µg/L) in 6.8 percent of wells nationwide. Except for nitrate, these contaminants in ground water all originate primarily from natural geologic sources. Escherichia coli (E. coli) was detected in 7.9 percent of 397 sampled wells… Total coliform bacteria… were detected in 34 percent of 378 sampled wells. Dissolved solids, pH, iron, and manganese were found at levels outside of Secondary Maximum Contaminant Levels (SMCLs) recommended by USEPA for drinking water in 15 to 21 percent of wells. Collectively, 48 percent of the sampled wells contained at least one contaminant or property at levels outside of SMCLs.
  10. Penn State Extension, Iron and Manganese in Private Water Systems. A survey by Penn State found excessive iron concentrations in 17% of the private water supplies sampled in the state. Natural sources of iron and manganese are more common in deeper wells where the water has been in contact with rock for a longer time.
  11. Farrell-Poe, K., Jones-McLean, L., and McLean, S., Private Water Well Components (AZ1486b), University of Arizona Cooperative Extension. Well screens are filtering devices used to prevent excess sediment from entering the well. Attached to the bottom of the well casing, the screens allow water to move through the well while keeping out most sand and gravel. High-speed water velocity, due to excessive pumping or improperly sized gravel pack, may result in erosion of the aquifer as sediment is pulled into the well.
  12. U.S. Geological Survey, Study Estimates about 2.1 Million People using Wells High in Arsenic (news release, 18 October 2017), on Ayotte et al., Environmental Science & Technology. …about 2.1 million people in the U.S. may be getting their drinking water from private domestic wells considered to have high concentrations of arsenic… Using a standard of 10 micrograms of arsenic per liter – the maximum contaminant level allowed for public water supplies… Nearly all of the arsenic in the groundwater tested for this study… is likely from natural sources.
  13. Centers for Disease Control and Prevention, Guidelines for Testing Well Water. Test your well water at least once every year for total coliform bacteria, nitrates, total dissolved solids, and pH level. Government officials do not regulate, treat, or monitor tap water from private wells. Test also when there are problems near your well, such as flooding, land disturbances, or nearby waste disposal sites, when you are notified that there are problems with well water in your area, when you or someone you live with becomes pregnant or a child starts living with you; and ask your health or environmental department, or the U.S. EPA, if you should also test your well water for: volatile organic compounds, lead, arsenic, mercury, radium, pesticides or herbicides, other chemicals or specific germs.
  14. U.S. Environmental Protection Agency, National Primary Drinking Water Regulations: nitrate (measured as nitrogen) MCL 10 mg/L; arsenic MCL 0.010 mg/L.

Waterdoctor · maps.waterdoctor.co · educational page, no products, no tracking